Dashboards and owner reporting
Know how today is going
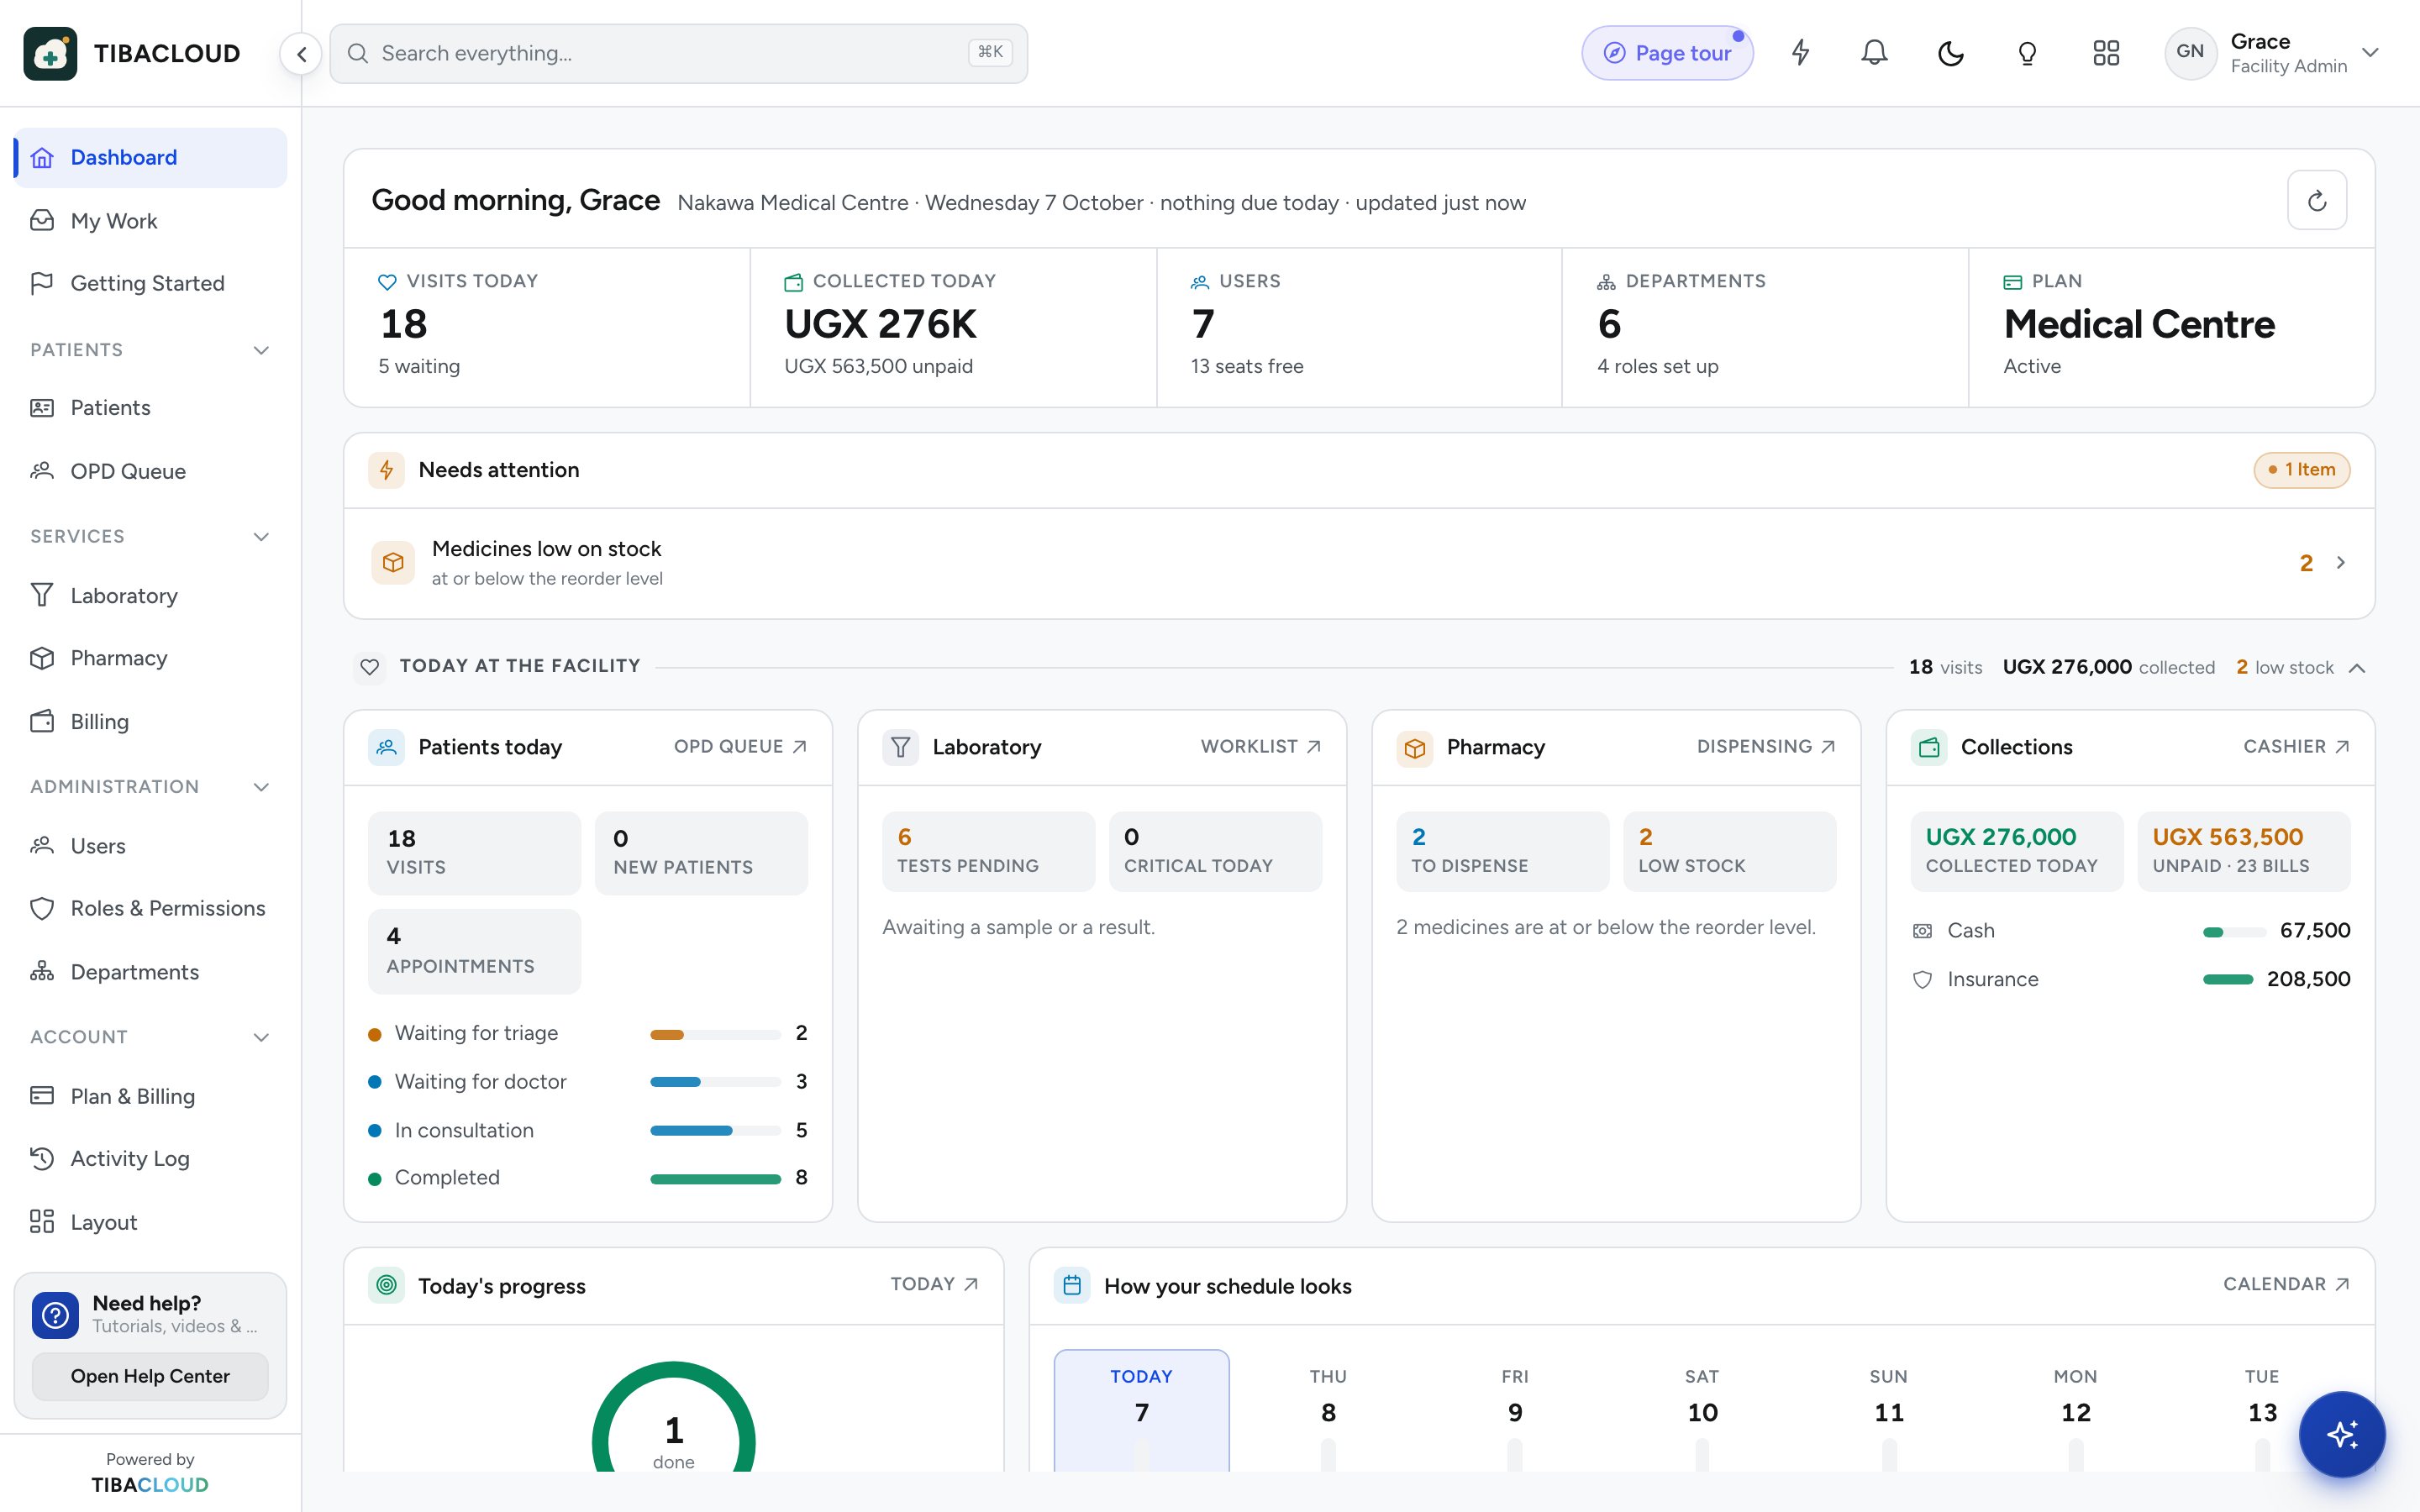
Patients seen, money collected, who is waiting and which beds are full, for today and against last week, on one page. With several branches, see them side by side.
Hospital plan and up. Multi-branch and API access on Enterprise.
Why facilities use dashboards and branches
Money you can see
Collections by day and by payment method, including mobile money, as they arrive.
Patients and queues
Patients seen today and who is waiting now, by service.
Bed occupancy
Beds occupied against beds available, updated as patients move.
Every branch
Several branches under one account, compared side by side on Enterprise.
Today
One page for the owner
The dashboard shows patients today, money collected, the live queue and beds occupied, each compared with the same day last week. It updates as staff work, with nothing to compile.
- Revenue for the last 14 days against the period before
- Live payments with the method used
- Queue by service: OPD, lab, pharmacy
Multi-branch
All your branches in one account
On the Enterprise plan, several branches run under one account. The owner sees each branch’s figures and compares them side by side.
- Several branches under one account
- Branch figures side by side
- Extra branches available as an add-on

Trends
Disease trends from your own records
Because diagnoses are coded in ICD-11, the top conditions seen each month come straight from the record. The same data feeds your national reports.
- Top diagnoses by month
- Attendance by age and sex
- Same figures as the ministry report
Dashboards and branches
Everything the owner needs to see
Revenue
Money collected by day, compared with the previous period.
Payment methods
Collections split by method, such as mobile money and cash.
Patients seen
Patients today against the same day last week.
Queue and waiting time
Who is waiting now, for which service and for how long.
Bed occupancy
Beds occupied and available across the wards.
Disease trends
Top diagnoses over time, from ICD-11 codes.
Multi-branch view
Branches compared side by side (Enterprise).
API access
FHIR and integration APIs for your own tools (Enterprise).
See dashboards and branches running on your own workflow
Hospital plan and up. Multi-branch and API access on Enterprise.
Dashboards and branches: questions
What does the TibaCloud dashboard show?
Patients seen today, money collected and how it was paid, who is waiting now, bed occupancy and revenue over the last two weeks. Each figure is compared with the same day or period before.
Can I see several branches in one account?
Yes, on the Enterprise plan. Several branches run under one account, and the owner can compare them side by side. Extra branches are available as an add-on.
Can I check the dashboard from my phone?
Yes. TibaCloud works on computers, tablets and phones, so owners can check the day from wherever they are.
Which plans include dashboards?
Dashboards are included in the Hospital and Enterprise plans. Multi-branch and API access are part of Enterprise.